
3. Set up your workbook
To create a dashboard, you’re going to need three separate sheets (or tabs) within your Excel workbook.
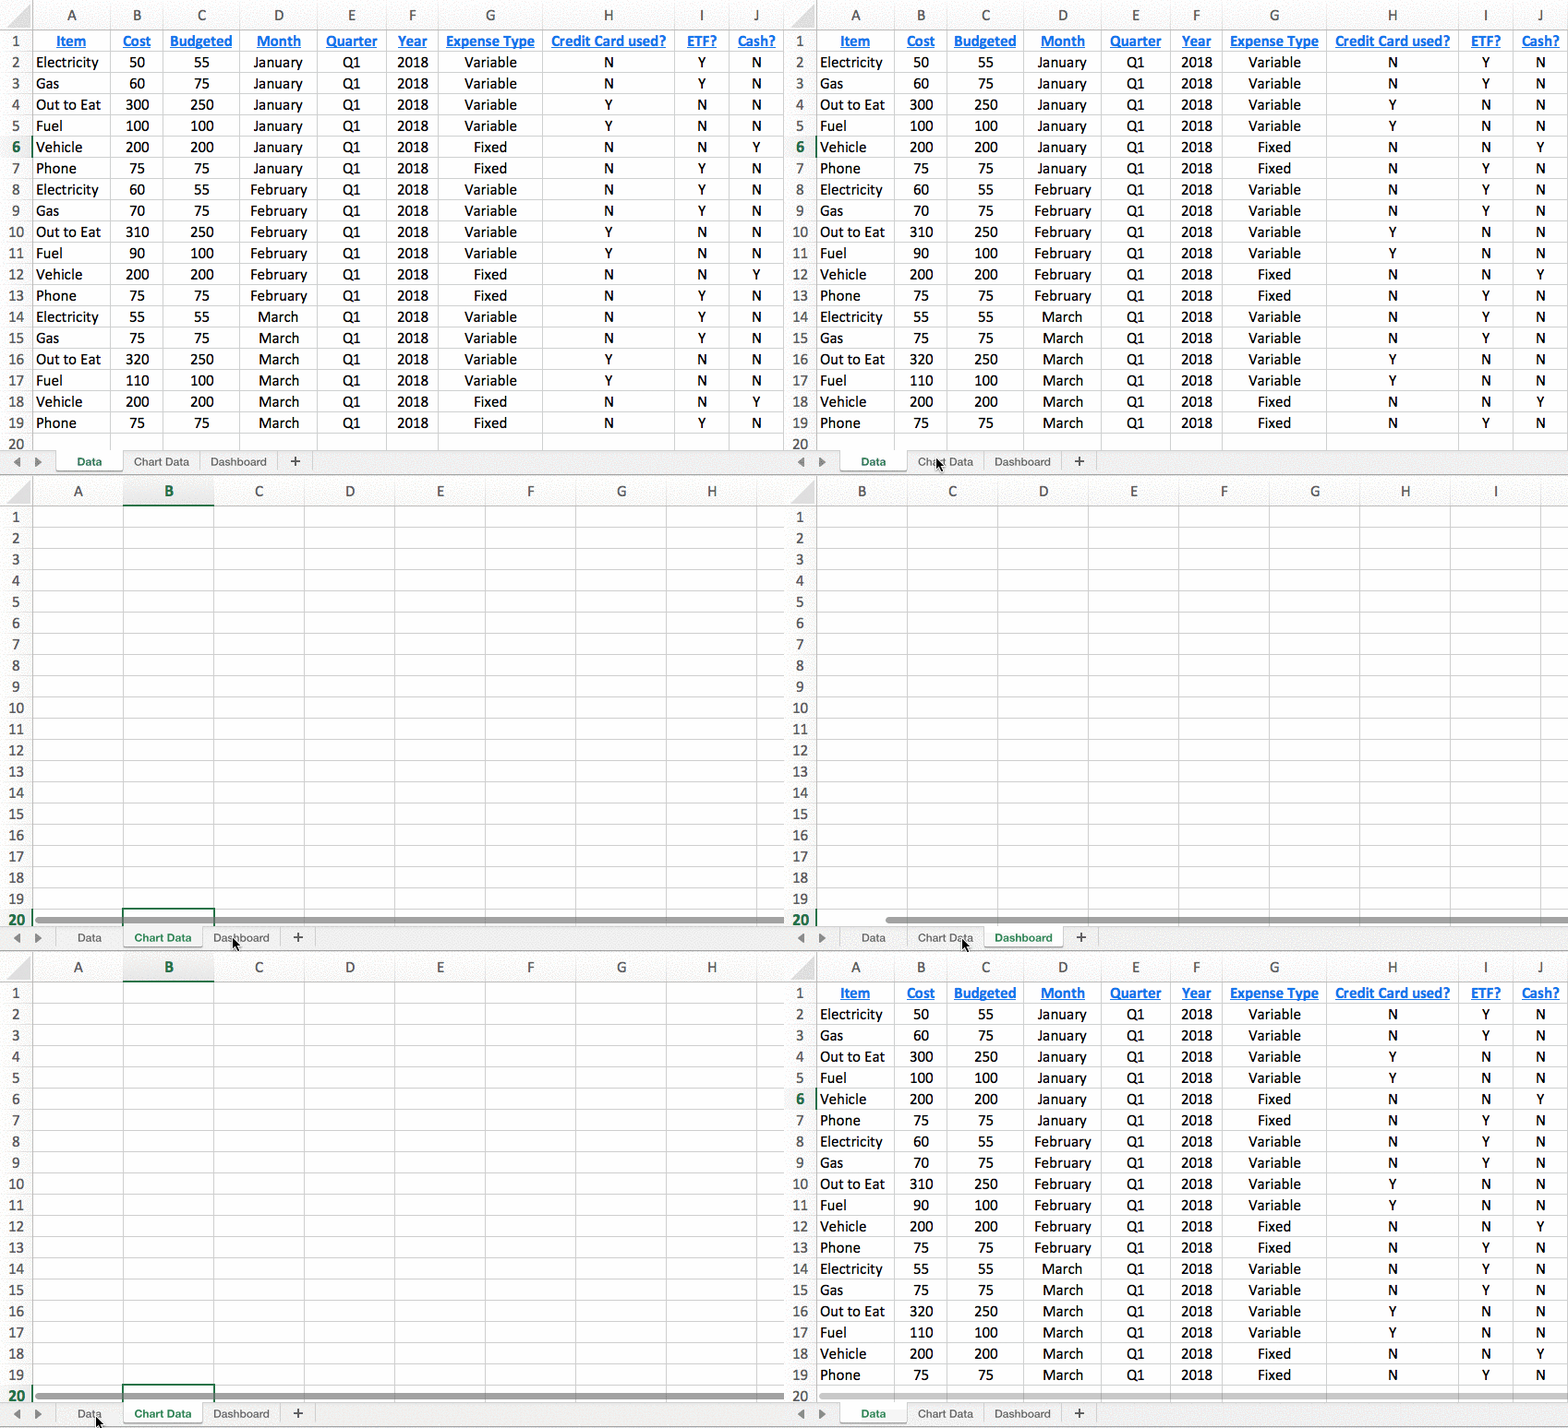
Name your first tab (the one that has all of your raw data on it) with something you’ll readily recognize such as “Data” or “Raw Data.”
Then, create a second tab labeled “Chart Data.” That tab is where you’ll store only the data that needs to be fed into different charts for the dashboard. Finally, create a tab labeled “Dashboard” where your various charts will appear.
You can leave those last two tabs totally blank for now! The important part is just to get your workbook set up and ready to work with.
4. Understand your requirements
When you start familiarizing yourself with dashboards in Excel, you’ll quickly realize that there are tons of options. Admittedly, that can be overwhelming which is why it’s important to get clear on the why of your dashboard first.
What’s your goal with this dashboard? Do you need to track progress? Analyze a budget? Identify trends?
By considering that first and foremost as well as things like who you’ll need to share this with and what format it will need to be in you’ll be empowered to design a dashboard that fits your needs.