
Data visualization sounds like a real party, doesn’t it? We can tell that you’re ready and raring to get started building your own dashboards.
However, before doing so, it’s essential that you lay the appropriate groundwork for dashboard design first. Here are a few things you’ll want to do before getting started:
1. Import your data into Excel
In order to create a dashboard, your data first needs to exist in Excel. If it’s already there, great there’s nothing more you need to do with this step.
If your data source isn't in Excel, you’ll need to import it into an Excel workbook, preferably into an Excel table. The major advantage of using official Excel tables for your source data is that it'll make it far easier to output a dynamic chart.
There are numerous ways to do this with ranging complexities depending on where your data exists currently. So, your best bet is to research how to import your specific data format.
2. Clean your data
When working with data within Excel, it’s important that each piece of information lives within its own cell.
If your existing spreadsheet is a bit of a jumbled mess, take some time to clean it up and ensure that things are organized into their appropriate rows and columns. It’s also wise to briefly analyze your data and make sure that no glaring typos or errors jump out at you.
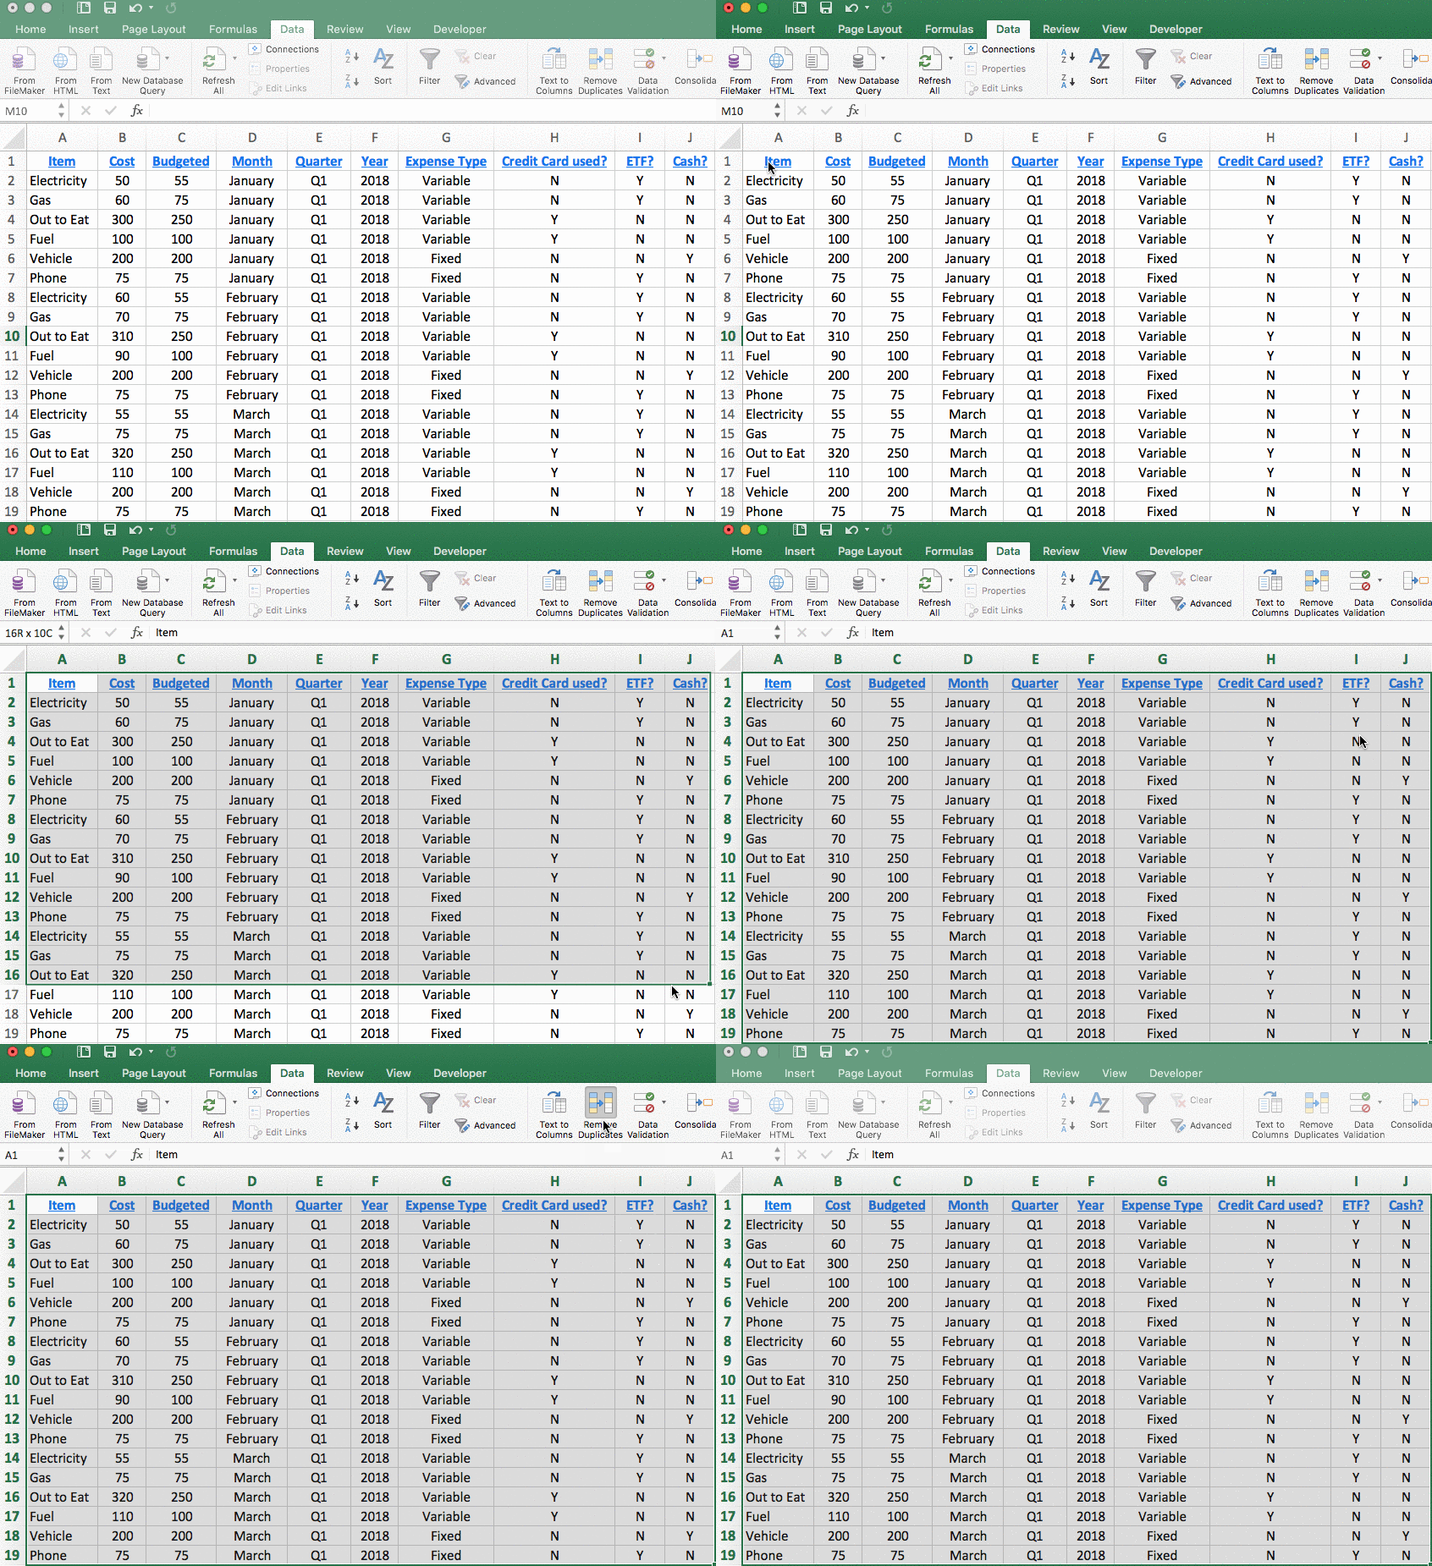
Now is also an excellent time to search for any duplicate information that needs to be deleted, because each row of data needs to be unique in order to utilize the dashboard feature otherwise you’ll be double counting.
Want a quick way to search for duplicates? Highlight your entire dataset and then click the “Remove Duplicates” button.