
7. Repeat the process for other data
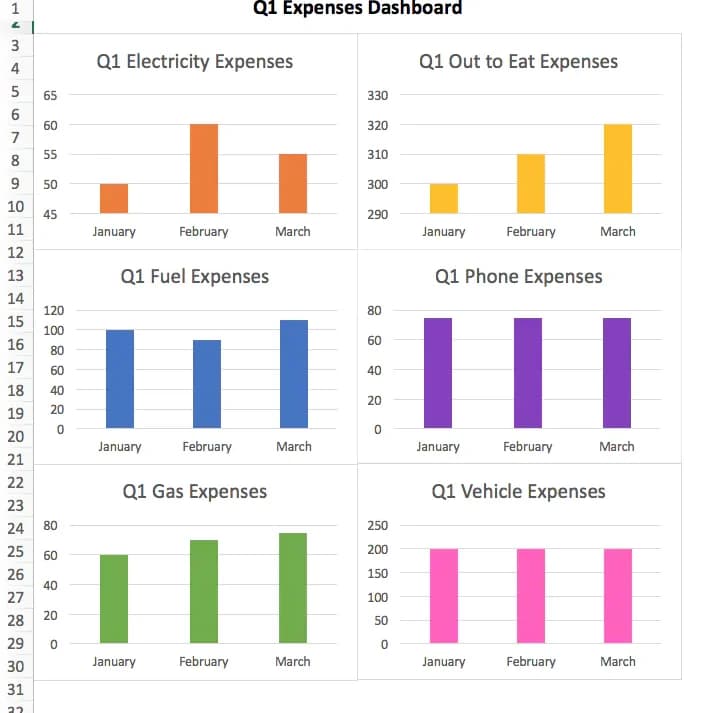
A true Excel dashboard includes several different charts and gauges to display data. So, to complete our dashboard in this example scenario, we’ll go back and repeat all of those steps for our other budget line items such as phone, vehicle, gas, etc.
One important thing to note: You don’t want to delete any data in your “Chart Data” tab since the data there, is what’s feeding your charts.
So, when going through the process of making your other charts, make sure to paste the new data sets below each other, rather than deleting and replacing them within that tab:
After we’ve done that? We’ll end up with a tab that shows how much we spend on each item each month.
See, that wasn’t so bad, was it?